Jutzi 2008 1D P-alpha Compaction Wave Validation
Overview
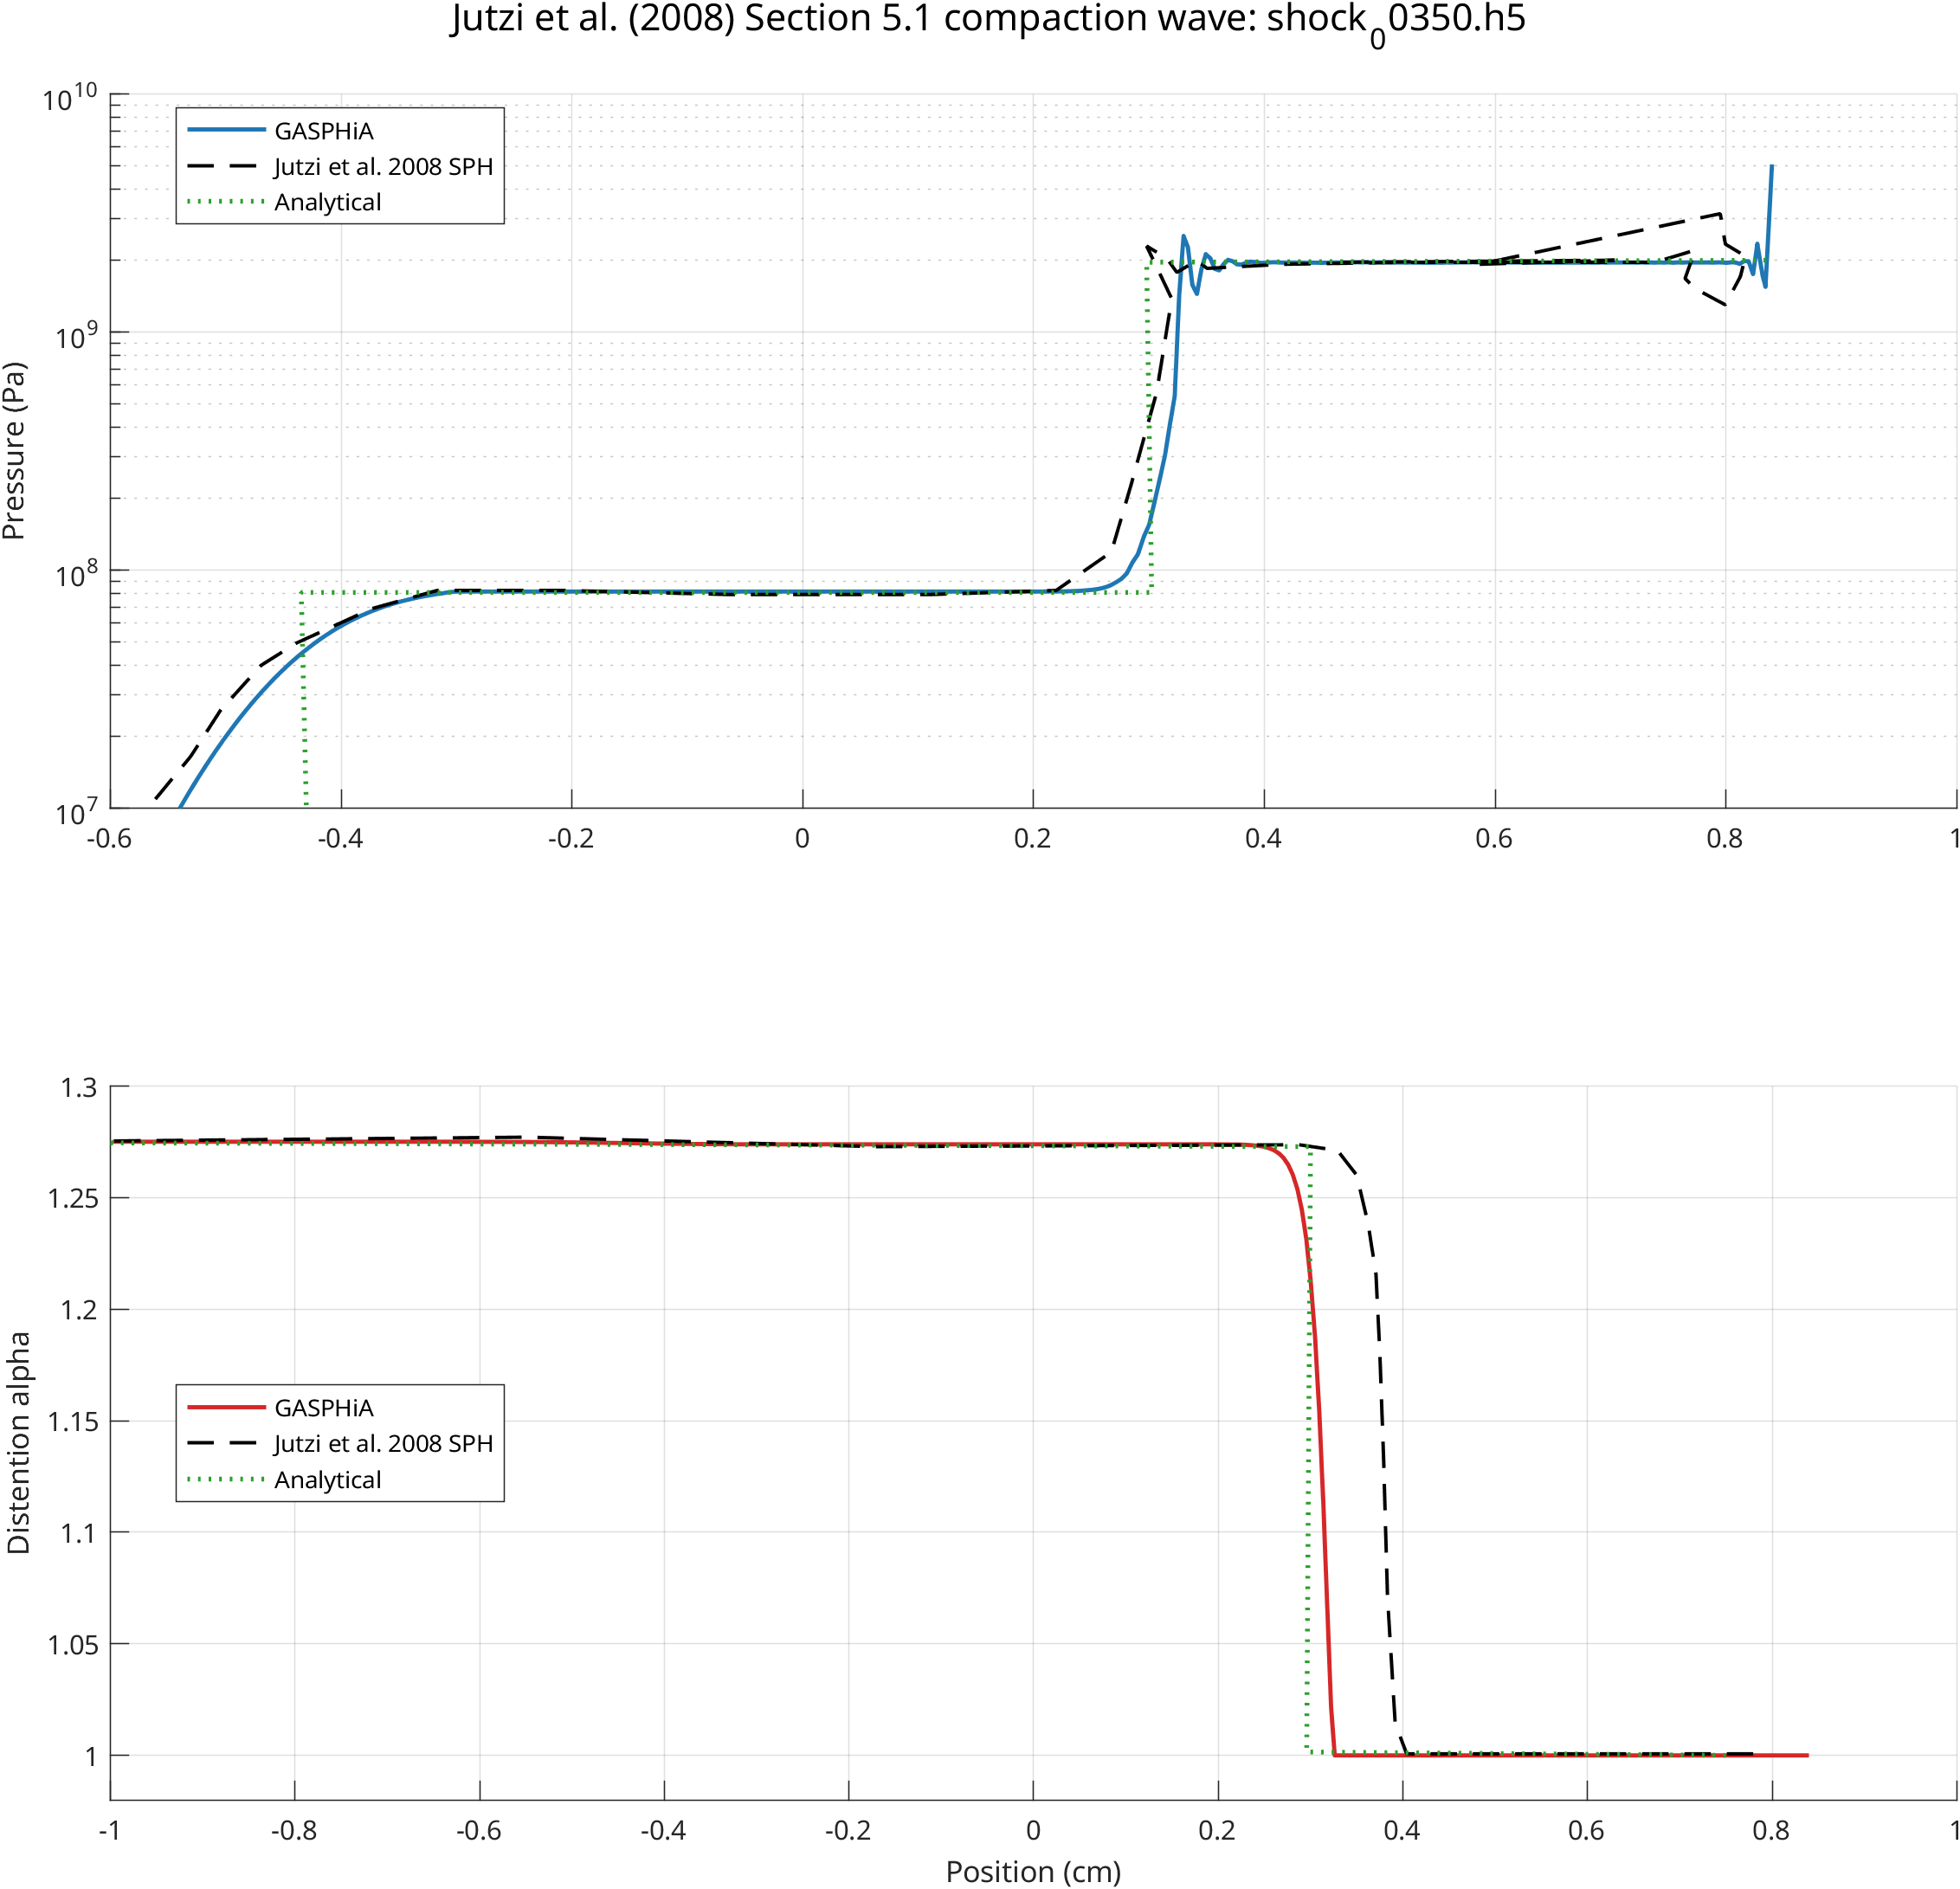
This case reproduces the 1D porous aluminum compaction wave test from Jutzi et al. (2008) Section 5.1, comparing the following physical quantities at a fixed time against the paper’s SPH curves and the analytical solution:
- Pressure distribution
- Distension
alphadistribution
This type of test is used to examine the performance of the p-alpha model in terms of wave front structure, compaction zone thickness, and post-wave compaction degree.
This run used shock_00350.h5 as the reference frame. Extracted results:
- Material 0 particle count:
400 - Pressure range: ~
1.07e-01 Pato5.07e+09 Pa - Distension range:
1.0to1.275
The compaction wave has driven the material from the initial porous state to a nearly fully compacted region.
Validation Objective
The physical picture of this case: a right-side moving piston drives a compaction wave through an initially porous aluminum rod. As the wave propagates forward, the material transitions from an initial distension of
$$ \alpha_0 = 1.275 $$toward a denser state.
How to Run
Test directory:
| |
Run with:
| |
The default workflow executes sequentially:
- Compile and run
input/gen_input_1d.cpp - Compile GASPHiA using the local
para.cuh - Run
compaction_wave.ini - Read
output/shock_00350.h5 - Output pressure / distension comparison plots
Note: this case’s para.cuh reserves a macro specifically for reproducing the experimental path:
| |
Result Interpretation
The figure is divided into two panels:
- Top: Pressure profile
- Bottom: Distension
alphaprofile
Each panel simultaneously plots three curves:
- GASPHiA computed results
- Paper SPH curve
- Analytical reference curve
Actual Run Data
Key metrics extracted from post-processing:
| Metric | Value |
|---|---|
| Reference frame | shock_00350.h5 |
| Material 0 particle count | 400 |
| Minimum pressure | 1.07e-01 Pa |
| Maximum pressure | 5.07e+09 Pa |
| Minimum distension | 1.0000 |
| Maximum distension | 1.2750 |
These values validate the simulation from two perspectives:
On the one hand, the output alpha covers the entire range from the initial porous state to the fully compacted state. On the other hand, the peak pressure has entered the GPa range, indicating that the compaction wave is sufficiently strong and has formed a genuine compaction structure.