Aluminum Mie-Gruneisen Hugoniot Validation
Overview
This case validates the correctness of the Mie-Gruneisen equation of state implementation for aluminum impact response in GASPHiA. The approach: apply a rigid piston at the right end of a 1D rod, sweep multiple piston velocities U_p, and extract from simulation results:
- Shock wave speed
U_s - Post-wave pressure plateau
P
These are compared against the theoretical Hugoniot relations:
$$ U_s = c_0 + sU_p, \qquad P = \rho_0 U_s U_p $$The case swept five velocities — 500, 1000, 2000, 3000, 5000 m/s — with stable results overall:
U_srelative error range:0.07% - 1.60%Prelative error range:0.30% - 1.15%
Validation Objective
Unlike the elastic uniaxial strain wave case, the focus here shifts from linear-elastic wave speed and deviatoric stress plateau to post-shock thermodynamic response. For a given material model, the states before and after the shock must lie on the corresponding Hugoniot curve to ensure thermodynamic consistency.
This case uses a 1D aluminum target and a right-side moving rigid piston, generating shocks of varying strength through different piston velocities. For each velocity case, the post-processing steps are:
- Fit the shock front position from multiple output frames to obtain the numerical wave speed
U_s - Average pressure and particle velocity on the stable post-wave plateau to obtain numerical
PandU_p
Theoretical Relations
The linear Mie-Gruneisen Hugoniot relation for aluminum used in this case is:
$$ U_s = c_0 + sU_p $$ $$ P = \rho_0 U_s U_p $$Parameter values:
- Initial density:
\rho_0 = 2700 kg/m^3 - Bulk sound speed:
c_0 = 5328 m/s - Hugoniot linear slope:
s = 1.338
Within this validation framework, the numerical results should answer two questions:
- Does the fitted
U_salign with the theoretical lineU_s = c_0 + sU_p? - Does the extracted post-wave pressure
Pfollow the theoretical curveP = \rho_0 U_s U_p?
If both hold, the basic Hugoniot response of the EOS can be considered reliable.
How to Run
Test directory:
| |
Run with:
| |
The script automatically performs the following steps:
- Compile the input generator
gen_input_hugoniot - Compile GASPHiA using the local
para.cuh - Run five piston velocity cases —
500, 1000, 2000, 3000, 5000 m/s— sequentially - Archive each set of outputs to
output_sweep/output_V*/ - Extract
U_s,U_p, andPand generate Hugoniot comparison plots
Consistent with other validation cases, this case references its own compilation parameters via PARA_CUH without modifying parameter files in the main source tree.
Result Interpretation
U_s - U_p Relation
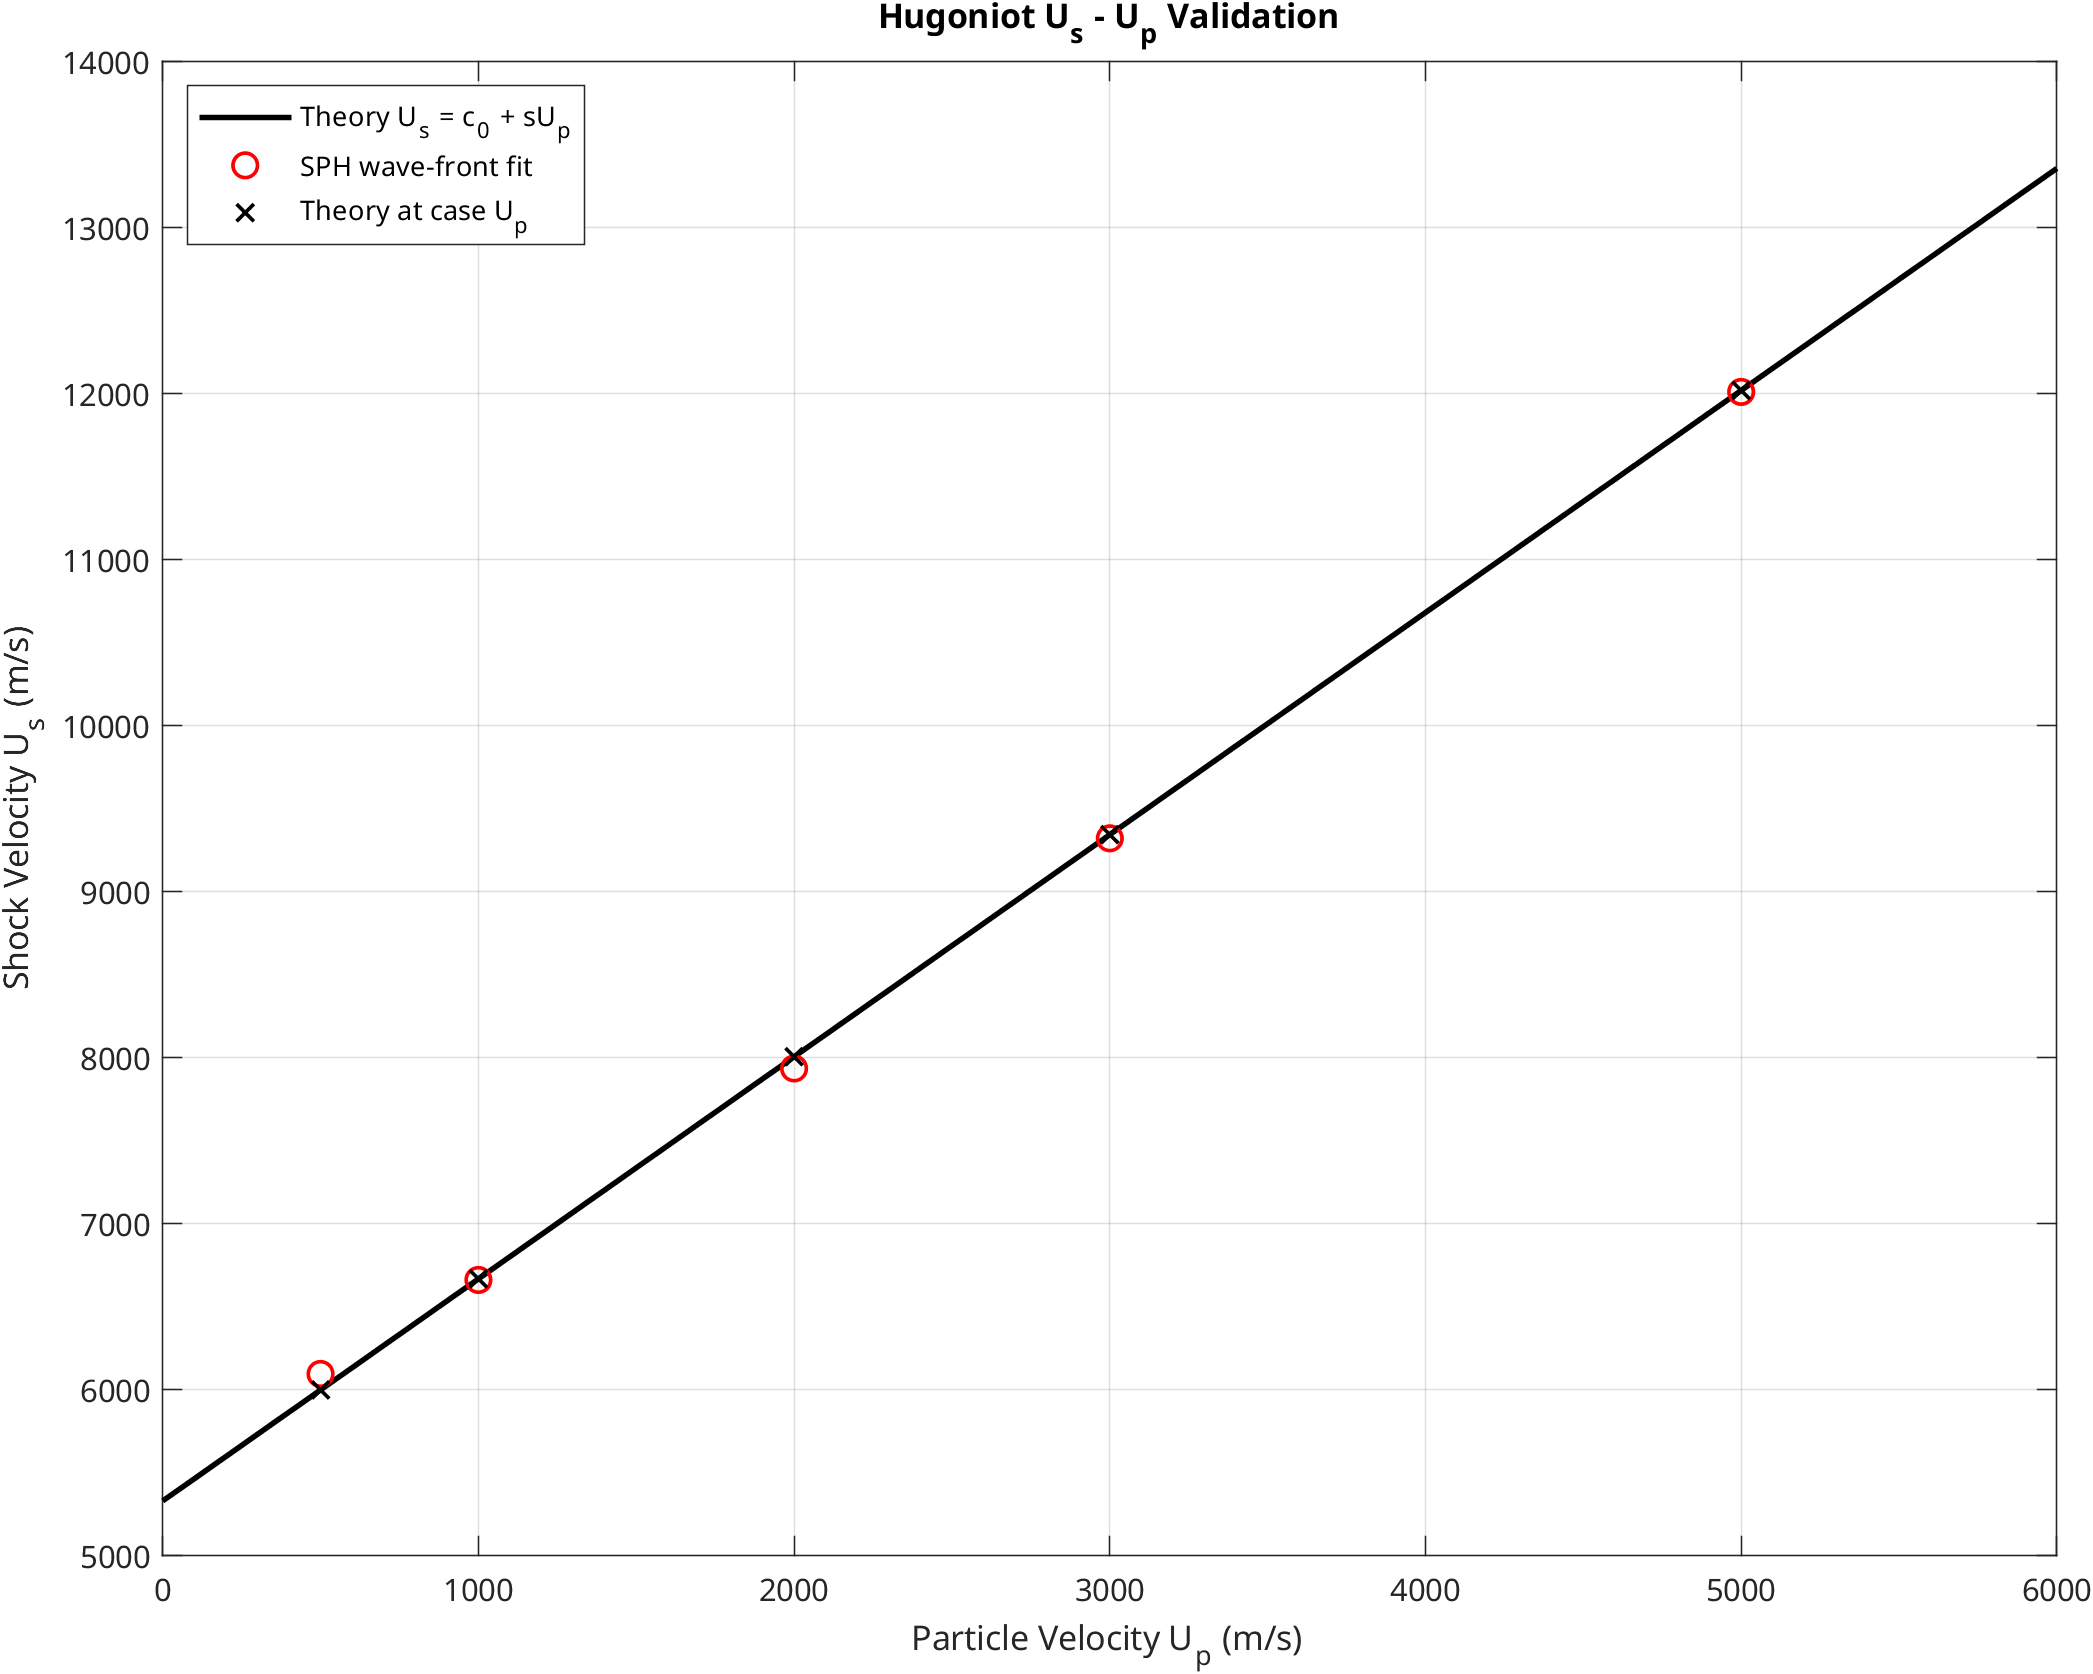
The core message of this plot: simulation-extracted shock speed points lie essentially along the theoretical line with no systematic deviation. For shock wave problems, this is the fundamental checkpoint for verifying whether the EOS wave speed response is correct.
P - U_p Relation
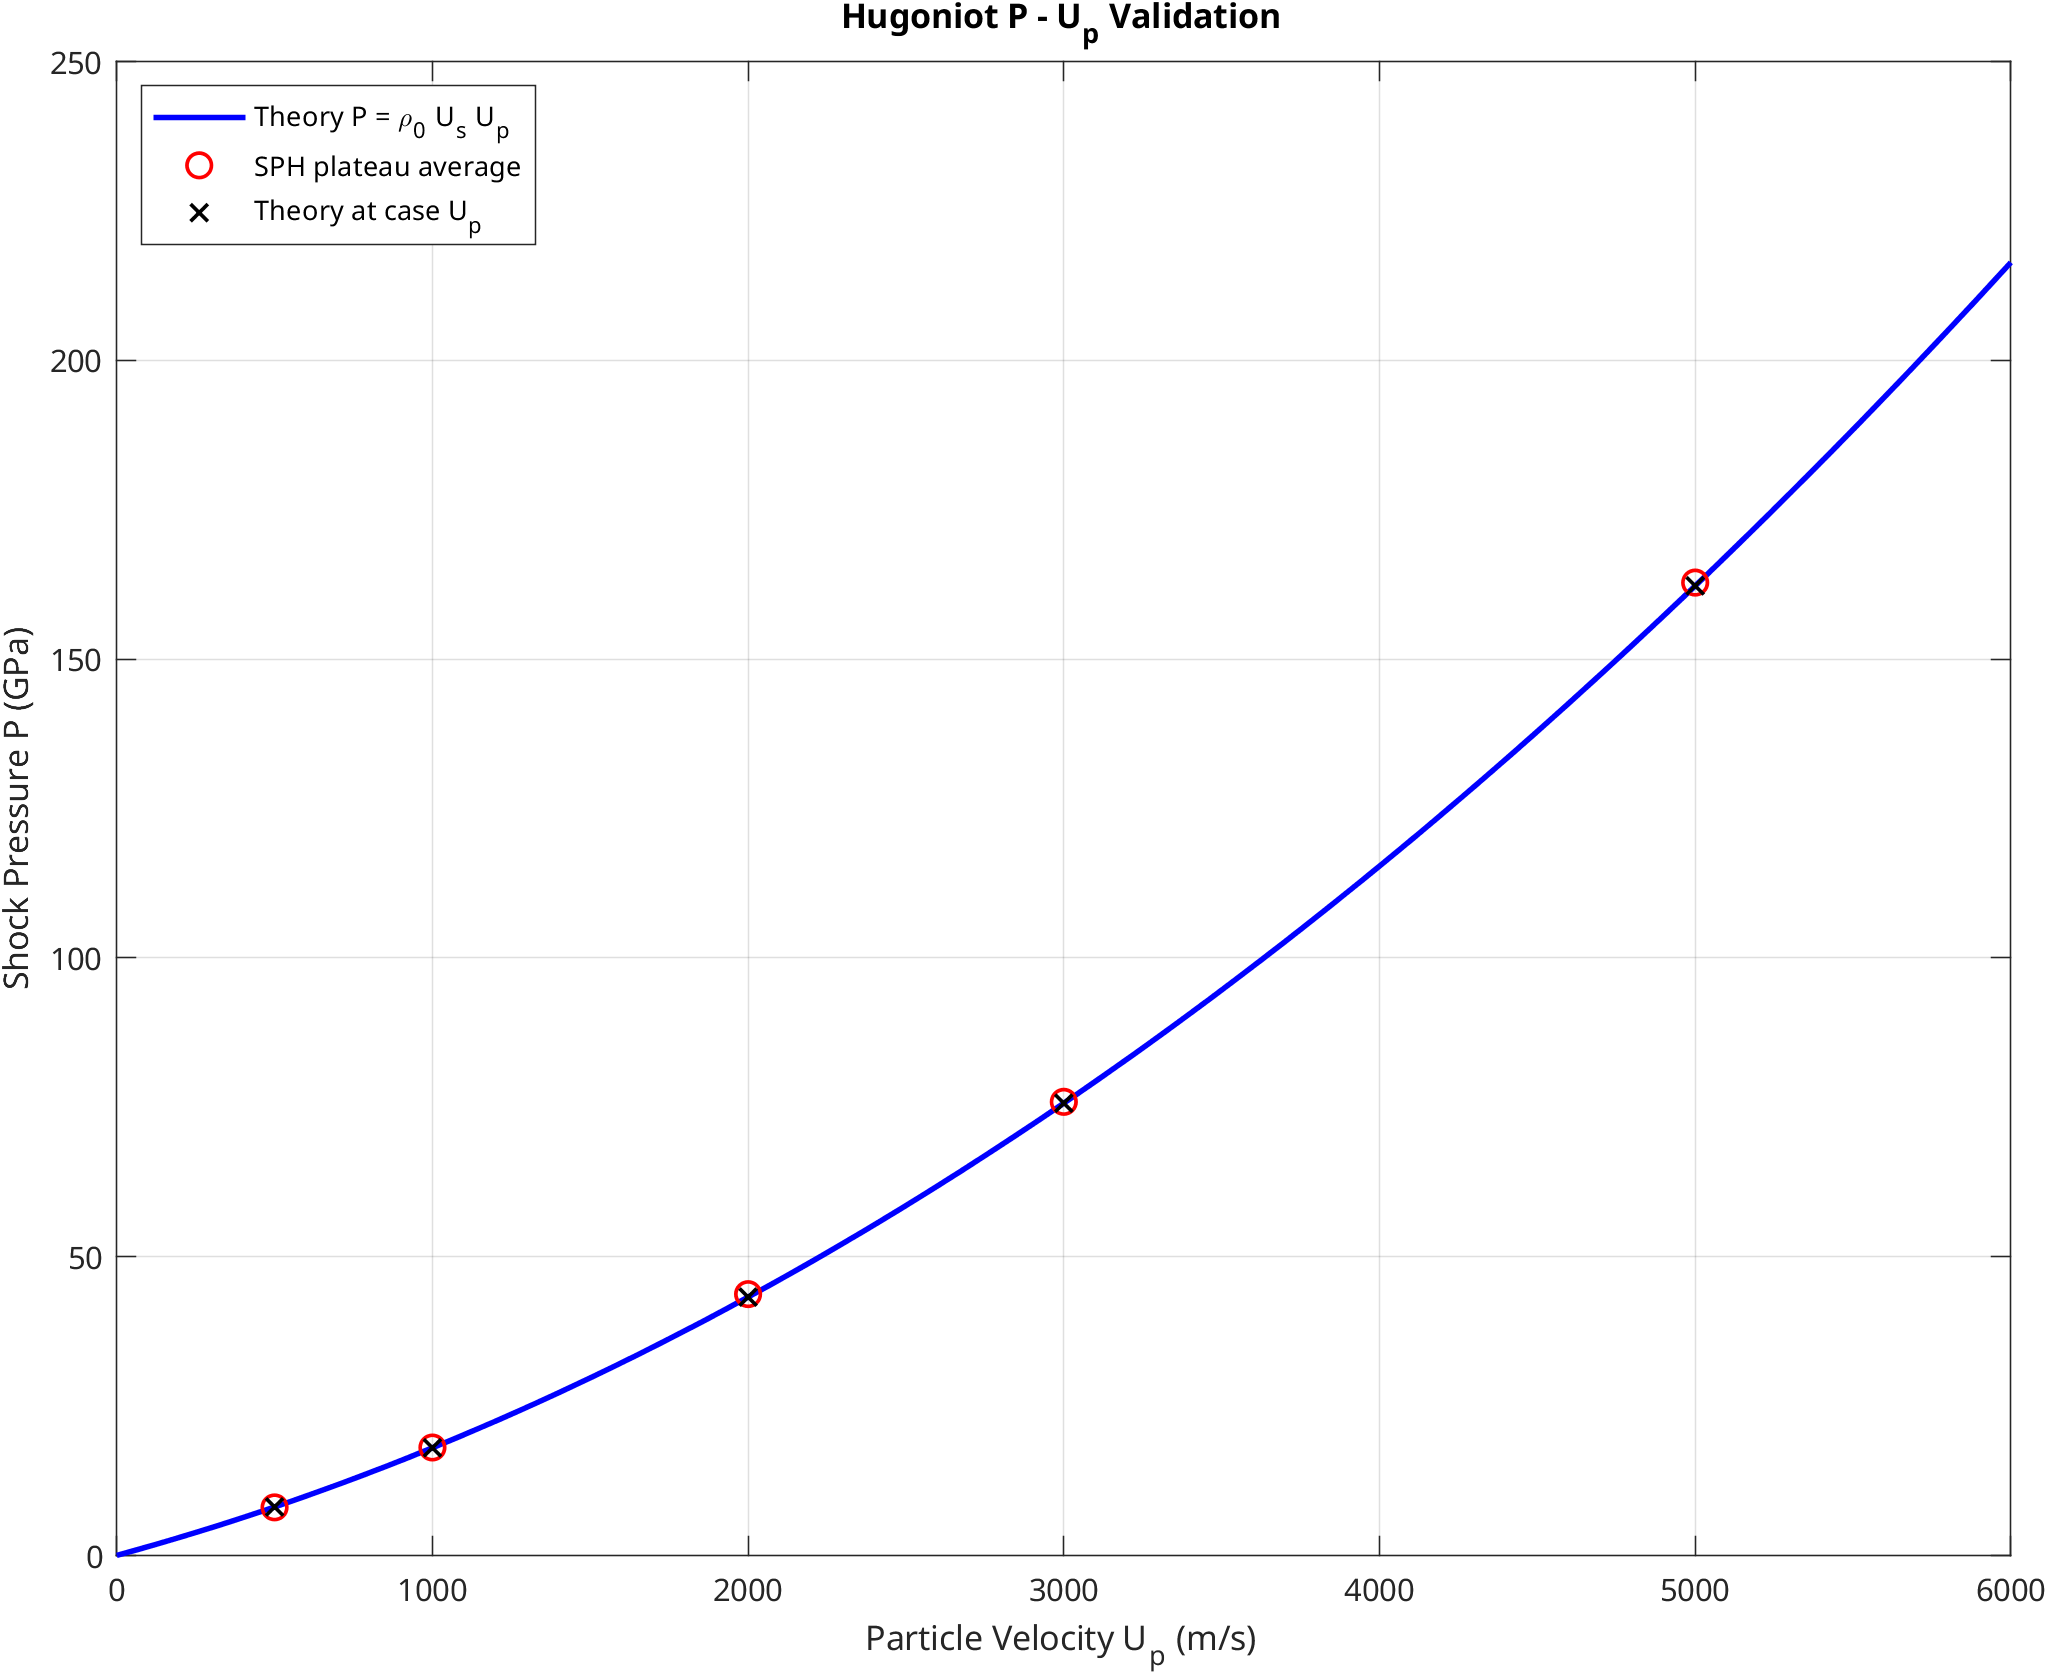
This plot shows the post-wave pressure plateau. Compared to wave front position, post-wave pressure is more sensitive to the EOS thermodynamic output. The simulation points show good agreement with the theoretical curve, indicating high consistency between post-wave pressure extraction and EOS response.
Actual Run Data
The velocity sweep results are as follows:
| Case Piston Velocity | Numerical Up | Theoretical Us | Numerical Us | Us Relative Error | Theoretical P | Numerical P | P Relative Error |
|---|---|---|---|---|---|---|---|
500 m/s | 500.04 m/s | 5997.00 m/s | 6093.02 m/s | 1.60% | 8.096 GPa | 8.032 GPa | -0.79% |
1000 m/s | 1000.02 m/s | 6666.00 m/s | 6659.35 m/s | -0.10% | 17.998 GPa | 18.052 GPa | 0.30% |
2000 m/s | 1999.93 m/s | 8004.00 m/s | 7933.33 m/s | -0.88% | 43.222 GPa | 43.719 GPa | 1.15% |
3000 m/s | 2999.66 m/s | 9342.00 m/s | 9319.76 m/s | -0.24% | 75.670 GPa | 75.895 GPa | 0.30% |
5000 m/s | 4999.44 m/s | 12018.00 m/s | 12009.28 m/s | -0.07% | 162.243 GPa | 162.792 GPa | 0.34% |
Two conclusions can be drawn from the table:
First, the piston velocity plateau extraction is stable, with numerical Up values very close to the set values, indicating that the post-wave plateau identification region is reasonably chosen. Second, neither of the two core quantities — Us and P — diverges as shock strength increases, demonstrating that this implementation maintains good consistency across the entire velocity range, not just for a single low-velocity case.